Conducted every five years, At Risk is the Bay Area’s most trusted land conservation research. In 2006, Greenbelt Alliance published the next edition this landmark study.
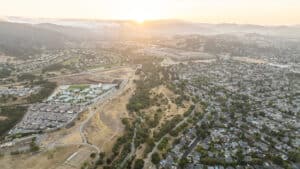
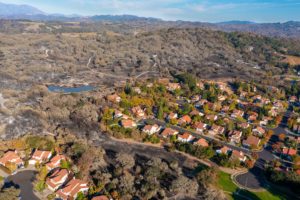
The report found that there are 401,500 acres of greenbelt lands at risk of sprawl development. That includes 125,200 acres at risk within the next 10 years, classified as high-risk land, and 276,200 acres at risk within the next 10 to 30 years, classified as medium-risk land. If current development patterns continue, roughly one out of every 10 acres in the entire Bay Area could be paved over in the next 30 years.
Also see At Risk 2012 and At Risk 2017.